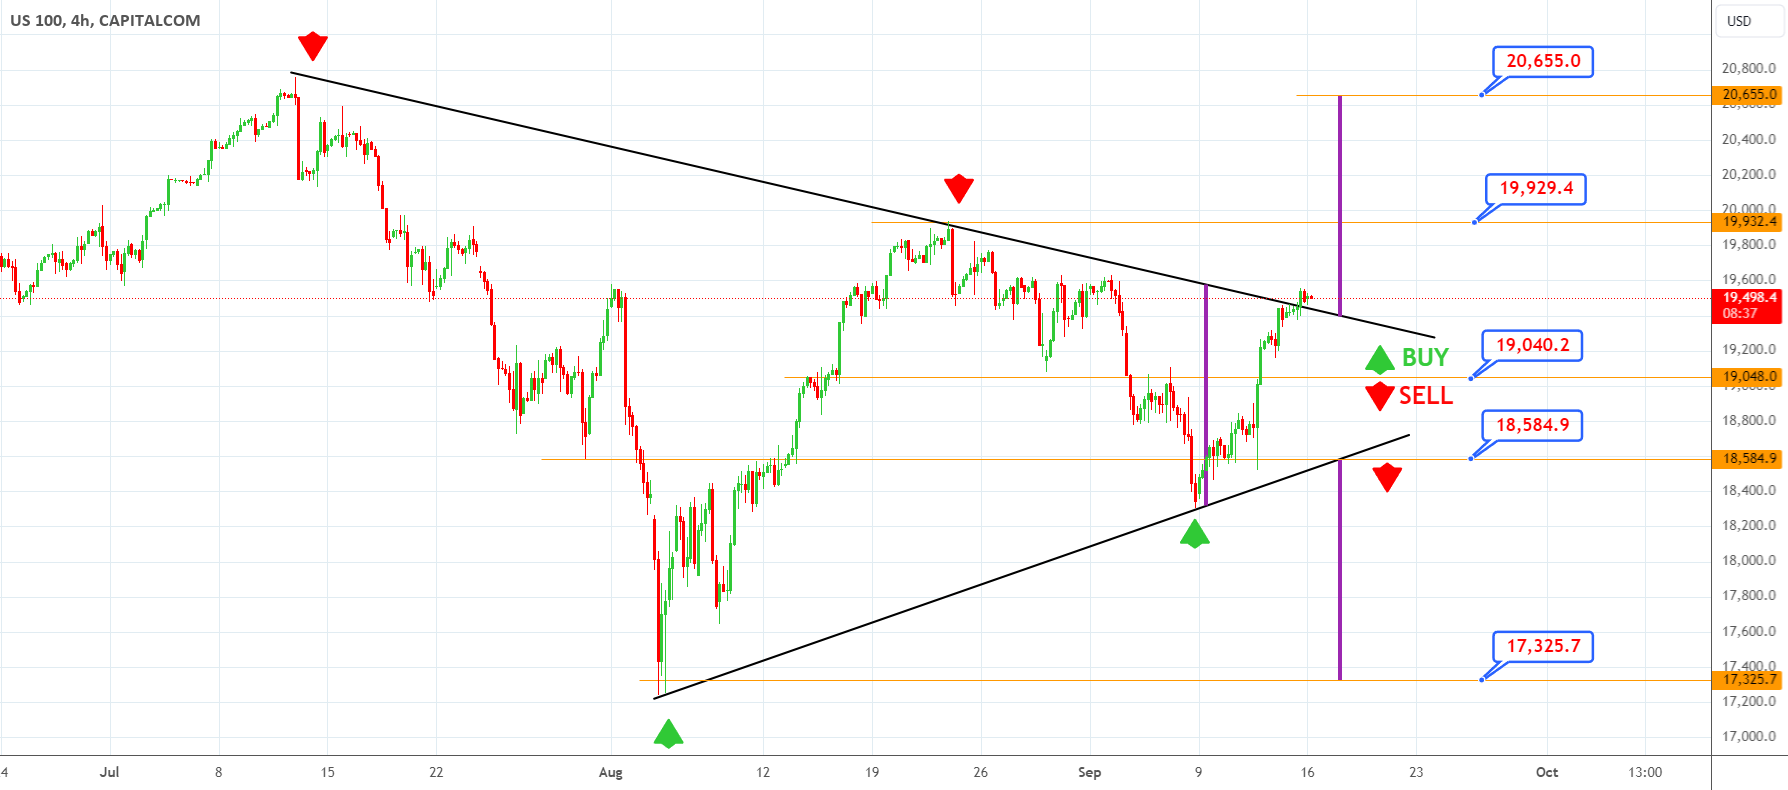
US100 NASDAQ Technical Analysis
When the US100 4-hour chart is examined; It is observed that the price movements continue on the triangle formation. It is evaluated that the index price can target the 20655 level by passing the 19929 level in price movements above the 19040 level, but it is evaluated that it can retreat to the 17326 level by breaking the 18585 level in price movements below the 19040 level.